


Тестовый вопрос

In this diagram, you can see the income distribution in Bolivia in 2020 based on the available microdata. The dashed line is the cumulative income (left axis), colorful bars represent income of all percentiles (without accumulation, right axis).
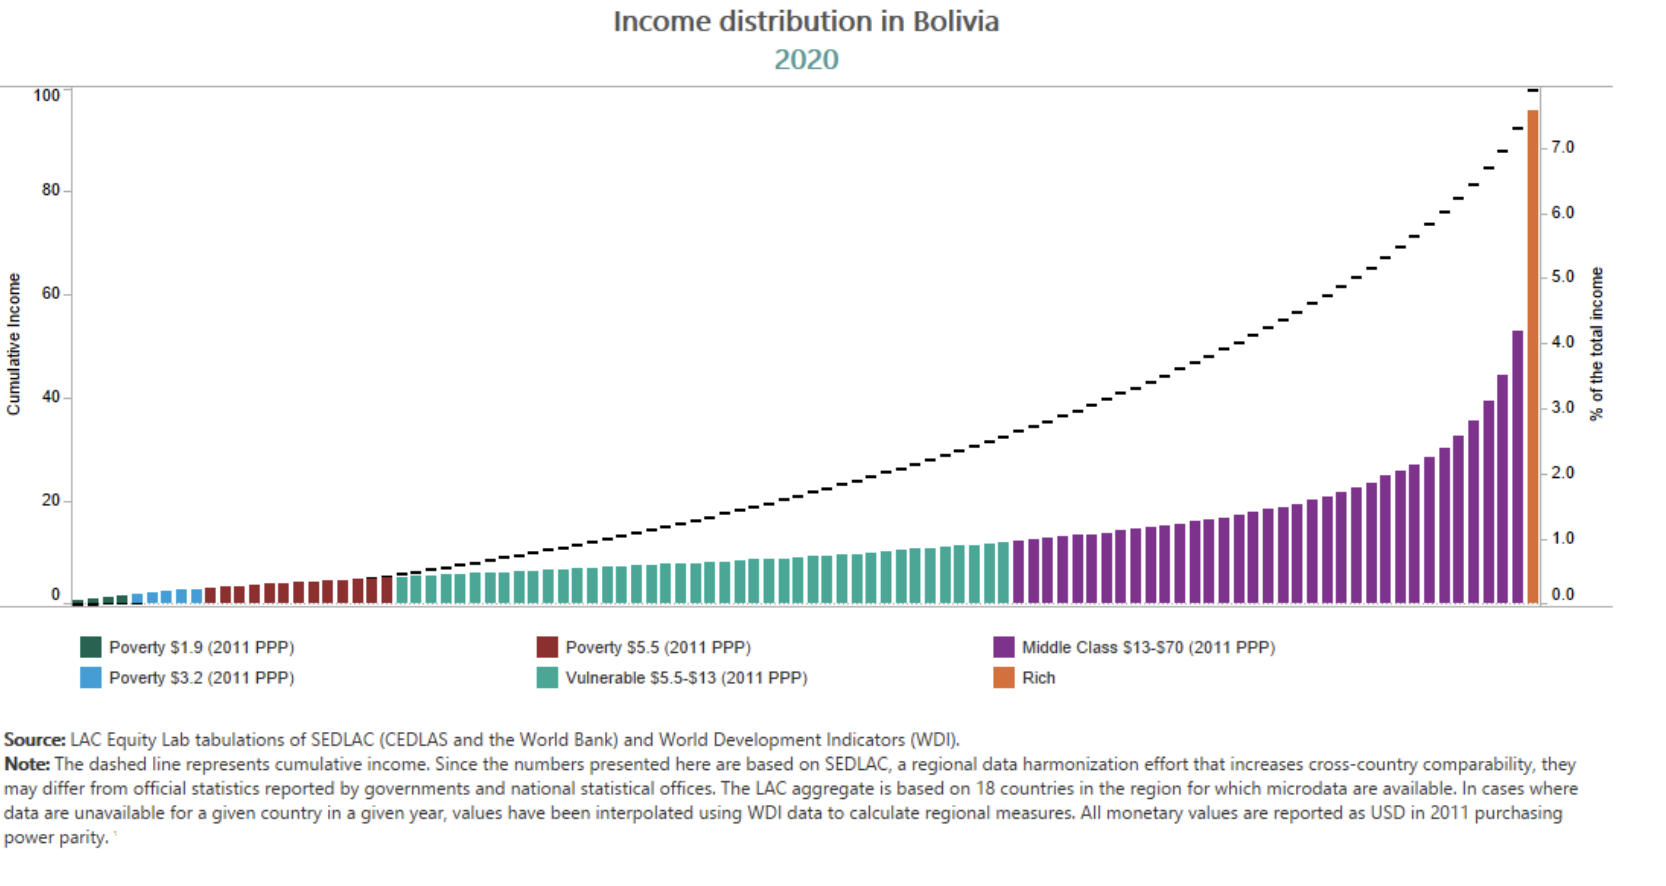
What is the closest estimate of the Gini Index?

Выберите один ответ

Войдите, чтобы проверять ответы

Похожие задачи

Тестовый вопрос

Which of the following best describes the concept of liquidity trap?

Тестовый вопрос

Choose the correct statement about public goods.

Тестовый вопрос

All prices in the economy have grown by 12% over the last year, Zoe's income has grown by 6%. Pick the right sentence.

Тестовый вопрос

Globalization during the late 19th century involved the exchange of agricultural and manufactured goods between land-abundant/labor-scarce countries and labor-abundant/land-scarce countries. Based on this information, which of the following statements is correct?