Тестовый вопрос

Сложная
Можно в метро
Для межнара

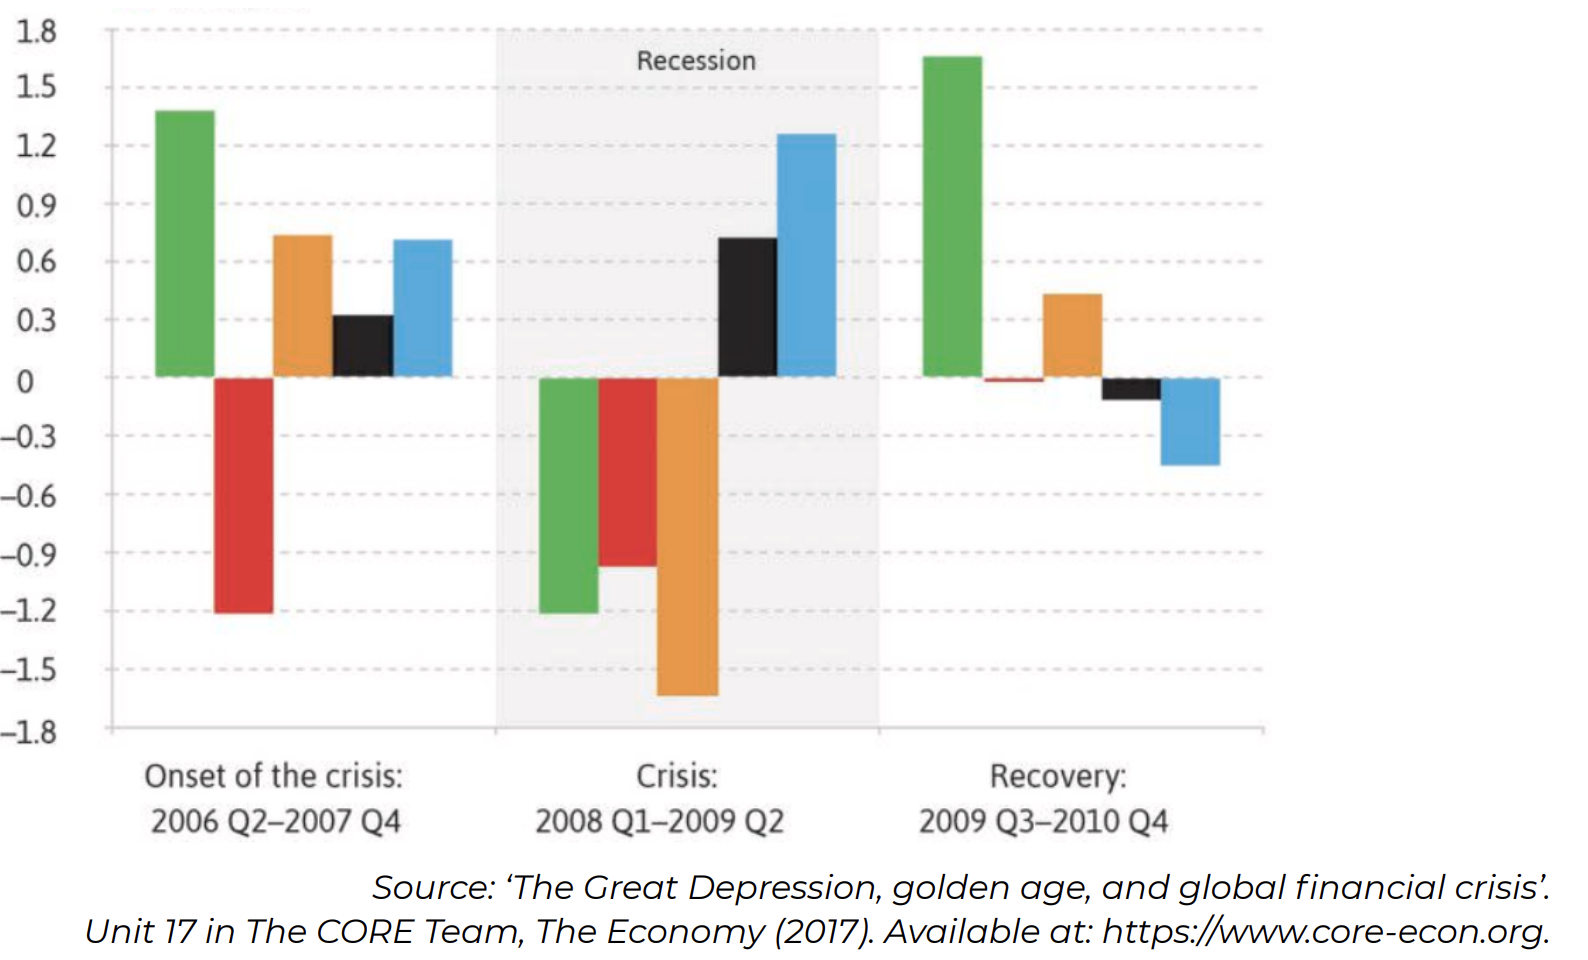
In this diagram, you can see the contribution of different components of the aggregate demand to the U.S. GDP change during the global financial crisis (in annual percentage points). The bars represent government spending, net exports, private consumption, residential and non-residential investment.

Выберите один ответ

Войдите, чтобы проверять ответы

Похожие задачи

Тестовый вопрос

Firm X uses capital and labor to produce its nal product. For every unit of a product, 1 unit of capital and 2 units of labor are needed. If labor and capital both cost $2 per unit, what is the marginal cost of producing the 18'th unit of a product?
Сложная
Можно в метро
Для межнара

Тестовый вопрос

Which of the following pairs of indicators commonly have positive correlation?
Сложная
Можно в метро
Для межнара

Тестовый вопрос

Which of the following is the least likely to prevent the 'Law on One Price' from holding in international trade?
Сложная
Можно в метро
Для межнара

Тестовый вопрос

The Coase theorem result does NOT apply if...
Сложная
Можно в метро
Для межнара