


Тестовый вопрос

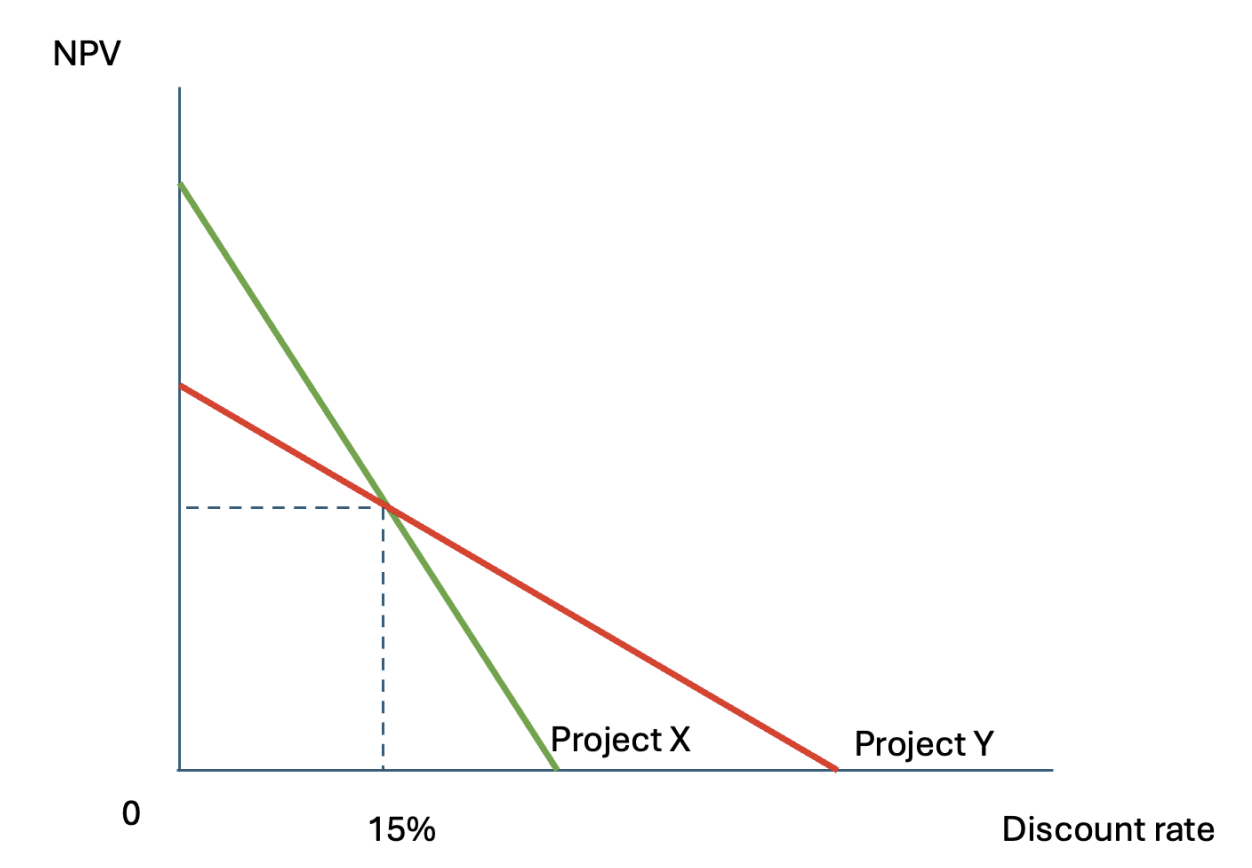
Discounted Cash Flow Methods Consider the following graph. Which of the following statements is true?
Выберите один ответ

Войдите, чтобы проверять ответы
Ответ

The graph shows that Project Y's NPV line intersects the x-axis at a higher discount rate than Project X's NPV line. This indicates that Project Y has a higher IRR than Project X. Statements B and C are opposite to the truth.

Похожие задачи

Тестовый вопрос

The diagram shows a competitive labor market. Which one of the following could NOT cause the increase in the wage rate from W to W1 as shown in the diagram?

Тестовый вопрос

A monopolist with the demand function Q = 100 − P and marginal cost MC = 20 faces the perunit tax of t =10. By how much will the price for consumers increase?

Тестовый вопрос

Which of these measures will by itself decrease the Gini coefficient of income distribution?

Тестовый вопрос

Which of the following best describes natural monopoly?