Lockdown and Inequality
During the first UK national lockdown in 2020, the government announced a furlough scheme for all full-time workers. Under this scheme, firms could apply for government support to pay up to 80% of the wages of workers who were unable to work (for example, because the rm was required to close during the lockdown).
(a) (6 rp) Use the concept of firm-specific assets' to explain why firms may prefer to furlough their workers during a temporary dip in demand (like the UK national lockdowns) rather than fire their workers or make them redundant. Give an example to support your explanation.
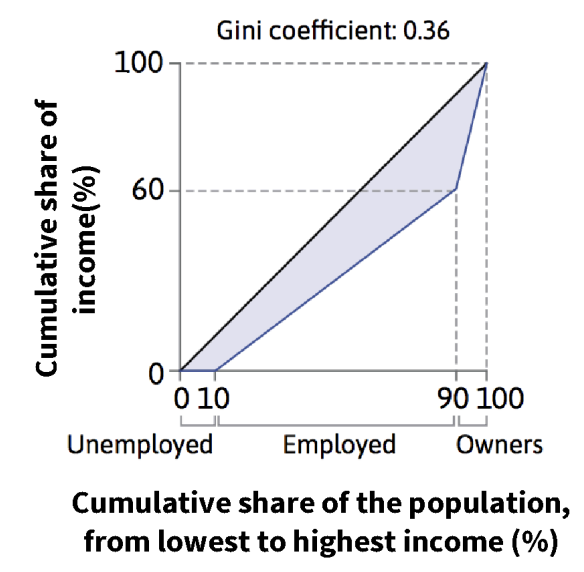
Other countries also implemented similar schemes during 2020. The diagram below shows the distribution of income before the COVID-19 pandemic, for a hypothetical country that consists of unemployed workers, employed workers, and owners (of capital). Each employed worker earns the same wage, and there are no unemployment benefits.
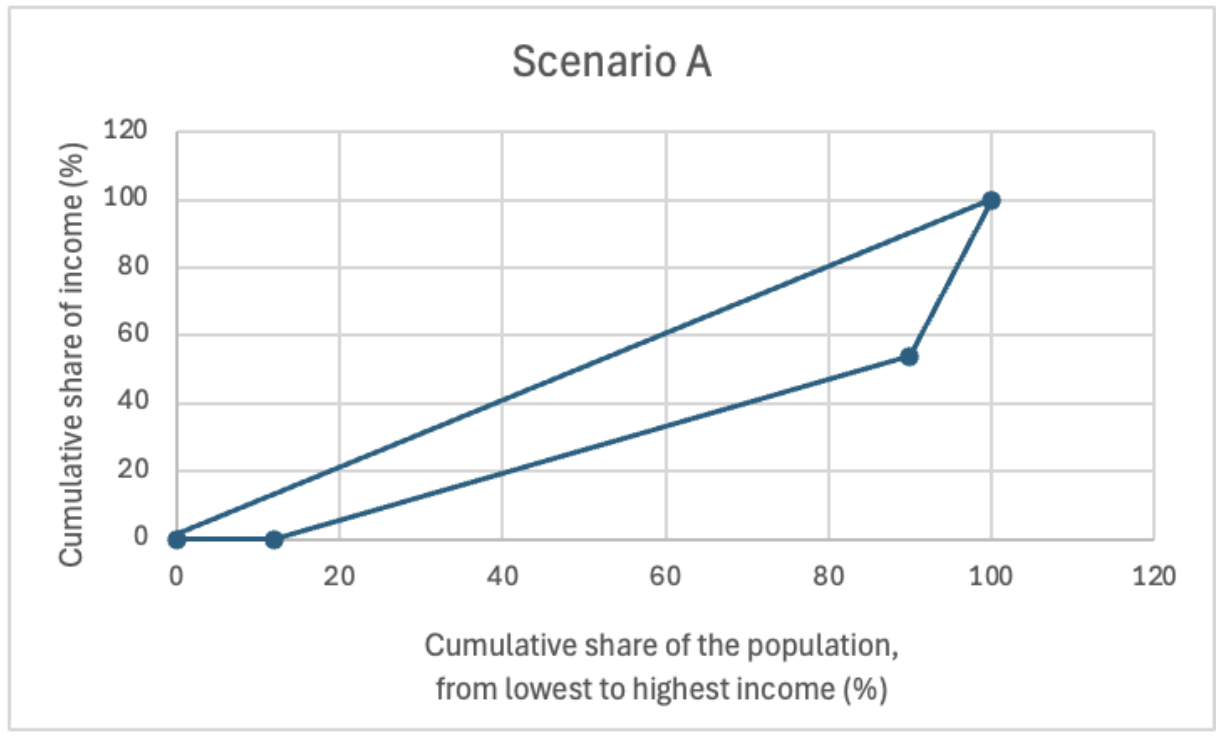
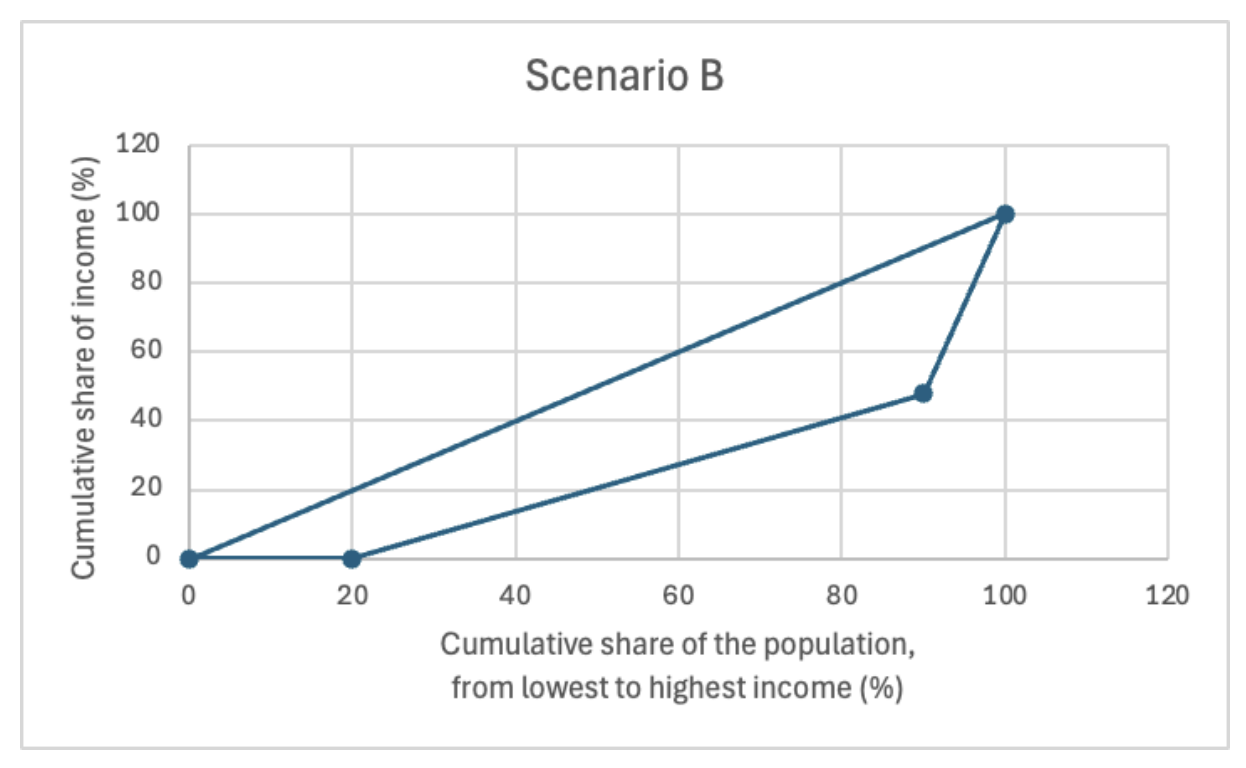
Suppose that this country implemented a furlough scheme during the COVID-19 pandemic (Scenario A). When the scheme was in effect, unemployment increased by 2 percentage points and the cumulative share of income for employed workers fell to 54%. Assume that all workers who remained employed were furloughed. Suppose that if the government had not implemented the furlough scheme, the unemployment rate would have increased by 10 percentage points and the cumulative share of income for employed workers would have been 48% (Scenario B).
(a) Firm-specific assets and furloughing workers (6 points)
Firm-specific assets are resources or skills that are valuable only within a particular firm. These can include specialized training, proprietary knowledge, internal networks, and collaborative relationships.
Firms may prefer to furlough their workers during a temporary dip in demand, such as the UK national lockdown, for the following reasons:
1. Retention of firm-specific skills and knowledge:
- Workers possess skills and knowledge that are tailored to the specific operations of the firm. Losing these workers would mean losing valuable assets that are not easily replaceable.
2. Cost of hiring and training:
- Rehiring and training new employees once demand recovers can be costly and time-consuming. Furloughing allows firms to quickly resume operations with experienced staff.
3. Employee morale and loyalty:
- Furloughing workers rather than ring them helps maintain employee morale and loyalty. Workers are more likely to return to a firm that demonstrated commitment to their well-being during difficult times.
Example: A boutique hotel faces significant declines in bookings due to lockdowns and travel restrictions. The hotel staff, including concierges, housekeepers, and chefs, are highly skilled in providing personalized guest experiences and have developed strong relationships with repeat customers. Furloughing these employees allows the hotel to retain their expertise and knowledge of the property, ensuring that when travel resumes, they can quickly reassemble a cohesive team that delivers exceptional service, rather than starting from scratch with new hires. Firing them would mean losing this valuable experience and jeopardizing the hotel's reputation in a competitive market.
(b) (16 rp) Describe how Scenario A and Scenario B change the shape of the Lorenz curve. By calculating the Gini coefficient in Scenario A and Scenario B (or otherwise), discuss the effect of the furlough scheme on income inequality.
(b) Impact of furlough scheme on income inequality (16 points)
To analyze the impact on income inequality, we compare Scenario A (with furlough scheme) and Scenario B (without furlough scheme).
Scenario A:
To calculate the Gini coefficient using the Lorenz curve, connecting the points (0, 0), (12, 0), (90, 54), and (100, 100), one can follow these steps:
1. Identify the area under the Lorenz curve (A):
This is the area between the line of perfect equality (the diagonal line from (0, 0) to (100, 100)) and the Lorenz curve.
2. Identify the total area under the line of perfect equality (B):
This is the area of the triangle formed by points (0, 0), (100, 0), and (100, 100).
B = 1/2 x base x height = 1/2 x 100 x 100 = 5000
3. Calculate area A under the Lorenz curve:
To find the area A under the Lorenz curve, one can break it down into segments based on the points given.
- From (0, 0) to (12, 0): This segment contributes no area.
- From (12, 0) to (90, 54): This can be calculated as a trapezoid.
- From (90, 54) to (100, 100): This can also be calculated as a trapezoid.
Area from (12, 0) to (90, 54):
Area = 1/2 x (Base1 + Base2 ) x Height
Here: Base1 = 0, Base2 = 54, Height = (90 - 12) = 78.
A1 = 1/2 x (0 + 54) x 78 = 1/2 x 54 x 78 = 2106
Area from (90, 54) to (100, 100):
A2 = 1/2 x (Base1 + Base2 ) x Height
Here: Base1 = 54, Base2 = 100, Height = (100 - 90) = 10.
A2 = 1/2 x (54 + 100) x 10 = 1/2 x 154 x 10 = 770
Total Area A under the Lorenz curve:
A = A1 + A2 = 2106 + 770 = 2876
4. Calculate the Gini coefficient:
The Gini coefficient G is calculated using the formula:
G = B - A/B = 5000 - 2876/5000 = 2124/5000 = 0.4248
Thus, the Gini coefficient is approximately 0.42.
Scenario B:
To calculate the Gini coefficient for Scenario B with the Lorenz curve connecting the points (0, 0), (20, 0), (90, 48), and (100, 100), one can follow these steps:
1. Identify the area under the Lorenz curve (A):
This is the area between the line of perfect equality (the diagonal line from (0, 0) to (100, 100)) and the Lorenz curve.
2. Identify the total area under the line of perfect equality (B):
This is the area of the triangle formed by the points (0, 0), (100, 0), and (100, 100).
B = 1/2 x base x height = 1/2 x 100 x 100 = 5000
Calculate area A:
To find the area A under the Lorenz curve, you can break it down into segments based on the points given.
- From (0, 0) to (20, 0): This segment contributes no area.
- From (20, 0) to (90, 48): This can be calculated as a trapezoid.
- From (90, 48) to (100, 100): This can also be calculated as a trapezoid.
Area from (20, 0) to (90, 48):
Area1 = 1/2 x (Base1 + Base2 ) x Height
Here: Base1 = 0, Base2 = 48, Height = (90 - 20) = 70.
A1 = 1/2 x (0 + 48) x 70 = 1/2 x 48 x 70 = 1680
From (90, 48) to (100, 100):
A2 = 1/2 x (Base1 + Base2 ) x Height
Here, Base1 = 48, Base2= 100, Height = (100 - 90) = 10.
A2 = 1/2 x (48 + 100) x 10 = 1/2 x 148 x 10 = 740
Total Area A Under the Lorenz Curve
A = A1 + A2 = 1680 + 740 = 2420
4. Calculate the Gini coefficient:
The Gini coefficient G is calculated using the formula:
G = B - A/B
Substituting in our values:
G = 5000 - 2420/5000 = 2580/5000 = 0.516
Thus, the Gini coefficient for Scenario B is approximately 0.52.
Effect on Inequality:
- In Scenario A, the Gini coefficient is 0.42, and in Scenario B, it is 0.52.
- Income inequality increases in both scenarios compared to the pre-pandemic level (Gini of 0.36).
- However, the furlough scheme in Scenario A mitigates the increase in income inequality compared to Scenario B.
(c) (8 rp) Suppose that during the pandemic, some of the unemployed workers joined the gig economy, where they could make some income but with a lower hourly wage than from formal employment. Analyze the potential effects of these gig economy workers on income inequality. State any assumptions you make.
(c) Impact of Gig Economy on Income Inequality (8 points)
During the pandemic, some unemployed workers joined the gig economy. Assuming gig economy wages are lower than formal employment wages, the impact on income inequality can be analyzed as follows:
Assumptions:
Gig economy wages are lower than formal employment wages.
Potential effects:
- Decreased income inequality:
- The unemployed workers who join the gig economy now earn some income, reducing the gap between the lowest and highest earners.
- The Lorenz curve will show a smaller gap between the lower-income group and the median-income group, potentially lowering the Gini coefcient.
- Description of Lorenz Curve:
- With gig economy income, the Lorenz curve becomes less steep in the lower-income segment, reecting increased income for previously unemployed workers.
- This reduces the overall area between the Lorenz curve and the line of equality, indicating decreased income inequality.
Example: If previously unemployed workers earned zero income and now earn 60% of the formal wage through gig economy jobs, their inclusion would shift the Lorenz curve upwards, closer to the line of equality.
Statement: It is clearly stated that unemployed workers join the gig economy, so stating that furlough workers might join too is considered to be wrong/irrelevant.