Тестовое задание
In this diagram, you can see the Gini coefficient for all individuals in the world (one of the lines, let's call it global inequality) and the Gini coefficient for all individuals as if income distribution within countries were perfectly equal (the other line, let's call it between-countries inequality).
What conclusion can be drawn from this diagram?
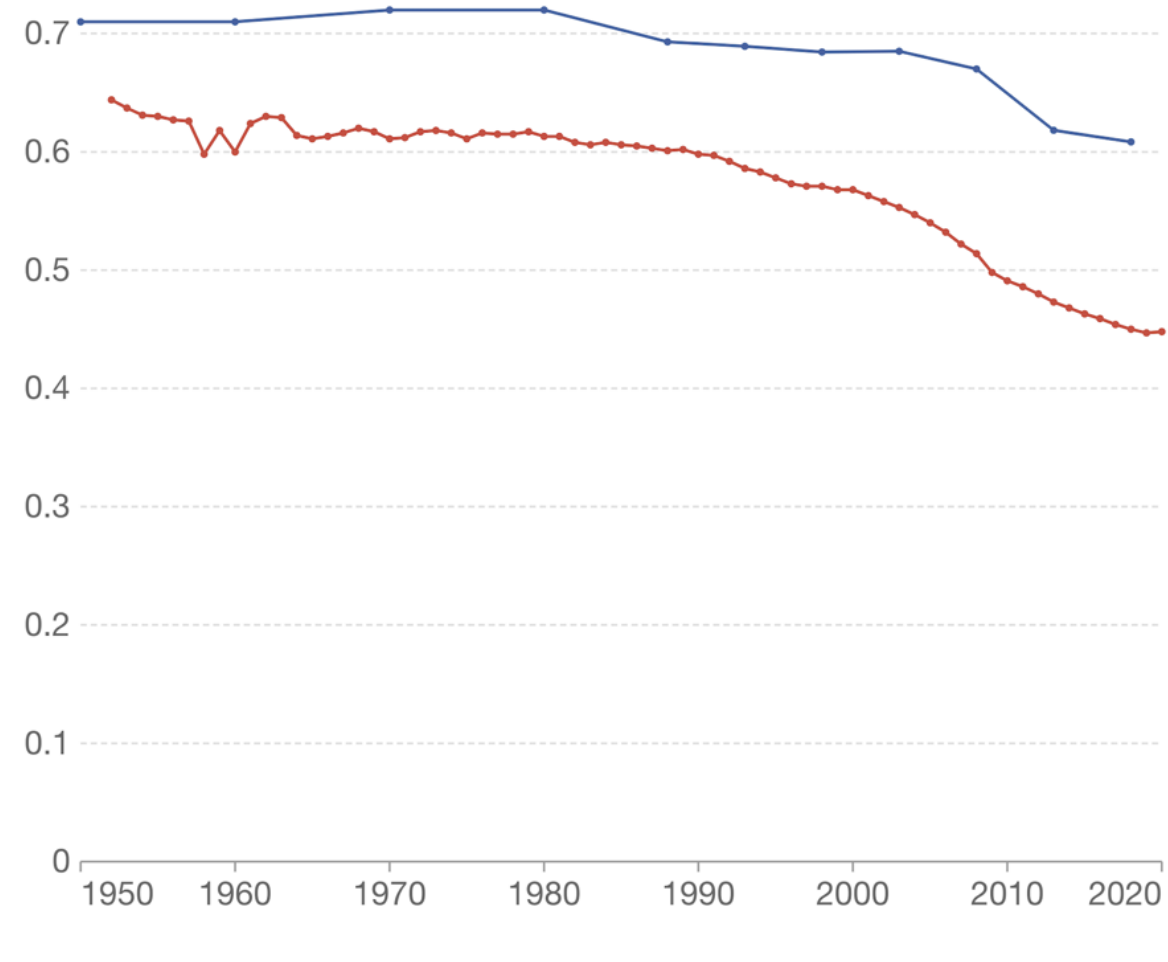
Source: Branko Milanovic. 2012. 'Global Income Inequality by the Numbers: In History and Now—an Overview'. Policy Research Working Paper 6259. The World Bank.